jQuery Comparative Histogram Plugin
I recently wrote a jQuery Plugin that I am calling jquery_comphist. It is a jQuery Plugin that draws a Comparative Histogram of a provided population divided into two major groups with any number of shared sub-groups. One of the most common uses for such a feature is when you are trying to display demographics data on some population. Anyways, as usual the code is available here (jquery.comphist.js, jquery.comphist.css) and you can see an example of it below.
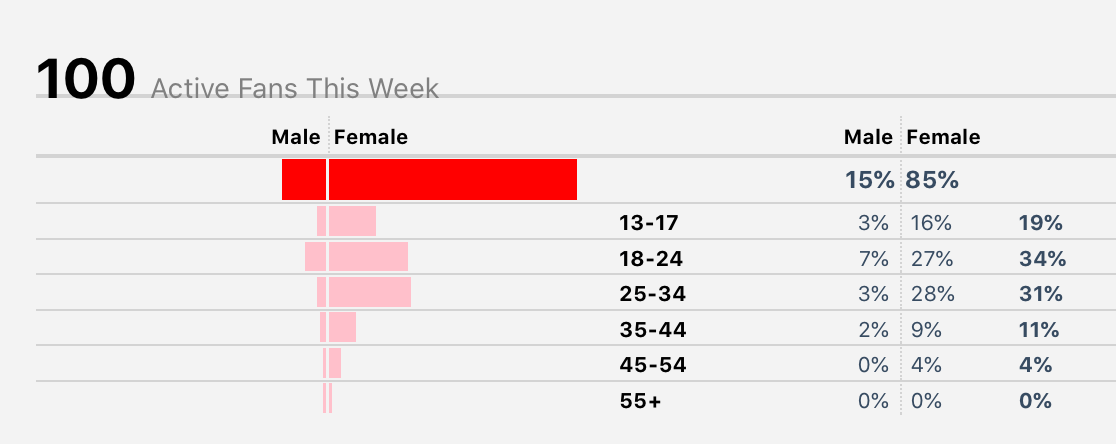
With the jQuery Comparative Histogram (CompHist) Plugin you can easily
represent populations and information about them. A prime usage exampe of this
is demographics. All the styling is done via CSS. Hence the style is easily
modified. It does the calculations for you and it allows for non listed group
counts via a non_demo_count data option.
The above demo was produced by defining a few code snippets. The first snippet is a snippet of HTML that includes the jQuery Comparative Histogram javascript source file and CSS style sheet. Note: The jQuery Comparative Histogram javascript source file needs to come after the standard jQuery javascript source file. An example of this snippet is as follows:
<script type="text/javascript" src="../jquery.comphist.js"></script>
<link rel="stylesheet" type="text/css" href="../stylesheets/jquery.comphist.css">
Note: In the above snippet the href values are likely to be different in your case. The second code snippet is simply a single line of HTML where the div that is to be the Comparative Histogram. It is key that this div has an id that is easily referenced and a set height and width. An example of this snippet is as follows:
<div id="compplaceholder" style="width: 375px; height: 200px;"></div>The third code snippet needed is the javascript that defines the data, creates the Comparative Histogram in the specified div, and handles the hover functionality. An example of this is seen below.
<script type="text/javascript">
$(function () {
	function showCompHistTooltip(x, y, contents) {
		console.log("called my shit");
		$('<div id="comphist1tooltip">' + contents + '</div>').css({
			position: 'absolute',
			display: 'none',
			top: y - 20,
			left: x - 30,
			border: '1px solid #fdd',
			padding: '2px',
			'background-color': '#fee',
			opacity: 1
		}).appendTo("body").fadeIn(200);
	}

	var comphist_data = {
		population_label: 'Active Fans This Week',
		group_1_label: 'Male', group_2_label: 'Female',
		subgroups: [
		{ label: '13-17', group_1_count: 3, group_2_count: 16 },
		{ label: '18-24', group_1_count: 7, group_2_count: 27 },
		{ label: '25-34', group_1_count: 3, group_2_count: 29 },
		{ label: '35-44', group_1_count: 2, group_2_count: 9 },
		{ label: '45-54', group_1_count: 0, group_2_count: 4 },
		{ label: '55+', group_1_count: 0, group_2_count: 0 }
		],
		non_demo_count: 0
	};
	$("#compplaceholder").comphist({}, comphist_data);

	$("#compplaceholder").bind("barover", function (e, perc, pos) {
		$("#comphist1tooltip").remove();
		showCompHistTooltip(pos.left, pos.top, perc);
	});

	$("#compplaceholder").bind("barout", function (e, perc, pos) {
		$("#comphist1tooltip").remove();
	});
});
</script>
Hopefully, the example helps get you up and running quickly.