Flot Multi-series Bar Graph Support
Hey boys and girls. I just got finished coding support for Multi-series bar graphs into Flot (a jQuery based JavaScript graphing library). Hence, I figured I would share not only the code but a little screenshot of it below. The code for it can be found here. Below is an example of how to use it.
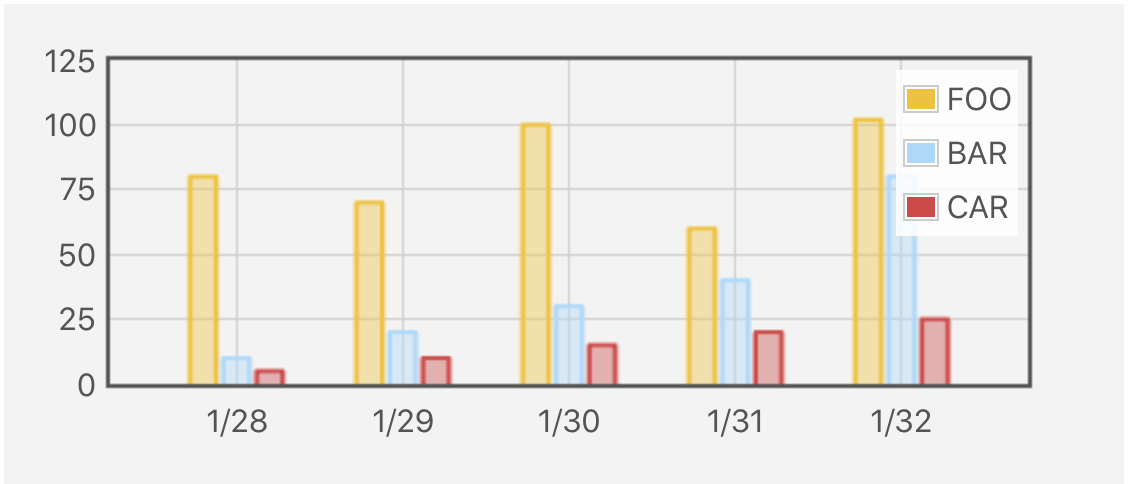
With the multi-series bar graph support, you can have Flot display the series side by side. This is useful when you are interested in visually comparing series and grouping segments you want to see columns in series that you are specifically interested in comparing.
The above screenshot was produced by defining a few code snippets. The first snippet is a snippet of HTML that includes the customized Flot javascript source file. Note: The Flot javascript source file needs to come after the standard jQuery javascript source file. An example of this snippet is as follows:
<!--[if IE]><script language="javascript" type="text/javascript" src="../excanvas.min.js"></script><![endif]-->
<script language="javascript" type="text/javascript" src="../jquery.js"></script>
<script language="javascript" type="text/javascript" src="../jquery.flot.js"></script>
Note: In the above snippet the href values are likely to be different in your case. The second code snippet is simply a single line of HTML that is the div that is to be the Multi-series Bar Graph. It is key that this div has an id that is easily referenced and a set height and width. An example of this snippet is as follows:
<div id="placeholder" style="width: 375px; height: 200px;"></div>The third code snippet needed is the javascript that defines the data, creates the Multi-series Bar Graph in the specified div, and handles the hover functionality. An example of this is seen below.
<script id="source">
$(function () {
	var ms_data = [{"label":"FOO","data":[[0,80],[1,70],[2,100],[3,60],[4,102]]},
								 {"label":"BAR","data":[[0,10],[1,20],[2,30],[3,40],[4,80]]},
								 {"label":"CAR","data":[[0,5],[1,10],[2,15],[3,20],[4,25]]}]
	var ms_ticks = [[0,"1/28"],[1,"1/29"],[2,"1/30"],[3,"1/31"],[4,"1/32"]];

		function plotWithOptions() {
			$.plot($("#placeholder"), ms_data, {
				bars: { show: true, barWidth: 0.6, series_spread: true, align: "center" },
				xaxis: { ticks: ms_ticks, autoscaleMargin: .10 },
				grid: { hoverable: true, clickable: true }
			});
		}

		function showTooltip(x, y, contents) {
				$('').css( {
						position: 'absolute',
						display: 'none',
						top: y + 5,
						left: x + 5,
						border: '1px solid #fdd',
						padding: '2px',
						'background-color': '#fee',
						opacity: 0.80
				}).appendTo("body").show();
		}

		plotWithOptions();

		$("#placeholder").bind("plothover", function (event, pos, item) {
			$("#x").text(pos.x.toFixed(2));
			$("#y").text(pos.y.toFixed(2));
				if (item) {
						if (previousPoint != item.datapoint) {
								previousPoint = item.datapoint;

								$("#tooltip").remove();
								var x = item.datapoint[0].toFixed(2),
										y = item.datapoint[1].toFixed(2);

								showTooltip(item.pageX, item.pageY,
														item.series.label + " Group id: " + Math.floor(x) + ", y = " + y + ", seriesIndex: " + item.seriesIndex);
						}
				}
				else {
						$("#tooltip").remove();
						previousPoint = null;
				}
		});

		$("#placeholder").bind("plotclick", function (event, pos, item) {
				if (item) {
						$("#clickdata").text("You clicked bar " + item.dataIndex + " in " + item.series.label + ".");
				}
		});
});
</script>
Hopefully the code example helps get you up and running.